Visualization consulting for IPO data
Description
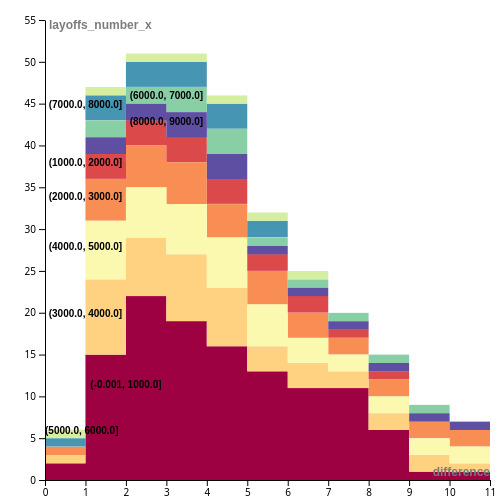
The AVL provided expert advice on visualizations of company IPOs and subsequent layoffs. Data cleaning was performed in OpenRefine and Python along with simple visualizations. Prototypes of advanced visualizations like beeswarm plots and streamgraphs were created using RAWGraphs (https://www.rawgraphs.io/).
Client
Matthew Josefy, Assistant Professor, Business
Staff
David Reagan
Sumitha Vellinalur Thattai
Sumitha Vellinalur Thattai
Services
Information Visualization, IQ Display Technologies
Start Date
Oct 22
End Date
Feb 23
