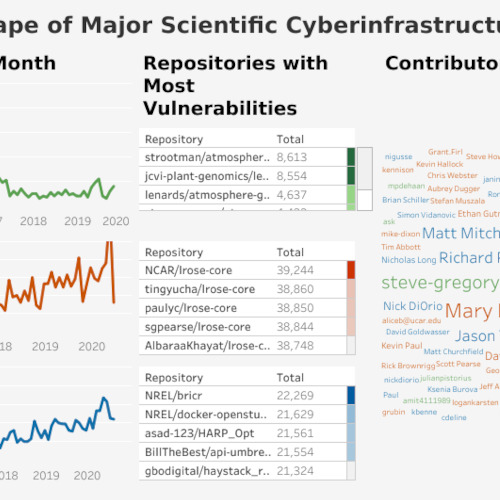
Cyberinfrastructure Vulnerability Dashboard Consulting
Description
The AVL provided expert critique of a visualization dashboard depicting the state of scientific cyberinfrastructure code security. The design was refined over multiple revisions for much-improved visual presentation and interaction. The dashboard went on to be accepted to PEARC Interact! at the 2022 PEARC conference.
Client
Sagar Samtani, Assistant Professor, Business and graduate student Ben Lazarine
Staff
Services
Information Visualization, Collectome
Start Date
Aug 2021
End Date
Jan 2022
